
Welcome to my online digital E-portfolio


Unit 9, Assessment 1 P1:
Spreadsheets can be used in a number of situations like businesses, schools and colleges. With spreadsheets you can find and access the data within seconds. There are many feature which help users to perform things like calculations, graphs and keeping information well-structured. Another feature which can help within businesses is formulas, there are different kinds of formulas to workout things like average, auto sum and VAT automatically. To access a spreadsheet you need to go to windows start button, click all programs go to Microsoft office then click excel 2013.
Uses of spreadsheet
-
Calculations: calculations are used in spreadsheets to work out mathematical equations like working out VAT, discounts, wages etc.
This is the auto sum symbol, you use this when adding a big list of figures. If you look at the screenshot to the right you can see my example, look at the box called F-11 it says =SUM (F2:F10) this means from box F2 to box F10 its adding all the figures.
-
Multiplying = *
-
Dividing = /
-
Adding = +
-
Taking away = -
There are many other uses for calculations within Excel and it all depends on what you are wanting it to do. The example below just shows a few functions.
-
Storing information: on excel, use the columns and rows in the spreadsheet to store information like numbers, names, codes etc. Columns and rows can be deleted or new ones can be inserted, they can be moved up down or anywhere on the spreadsheet.
-
Structure: spreadsheet is made of rows and columns and cells, these can be added/deleted at any time. You can have more than one sheet on a spreadsheet and even name them whatever you want to. Spreadsheet can be shared by email, link, PDF, XPS and internet fax.
-
To make calculations fast: spreadsheet created formulas to make working out information a whole lot easier, say you have a long list of figures that need to be added just use auto sum, it will add them up in seconds. Any alterations made will be auto updated also within seconds. When working out formulas that require the same method, all you need to do is work out the first one then at the bottom left corner of the cell, click and drag down as show above.
-
Charts: charts are one of spreadsheets most used features, charts are used for showing data recorded over a number of weeks like profits in business. To create a chart go to the ribbon and click insert, make sure to highlight the data that you want to be put into a chart. There are different types of charts like column, line, pie, bar, area and scatter.
Unit 9 M1:
Businesses can improve productivity, accuracy and usability by using spreadsheets correctly. They can do this because of the features of spreadsheet, one feature is auto update. When using formulas to work out information if you write the formula correctly when it comes to updating the information you won’t have to re-write everything, you should just be able to replace a few figures and it will auto update your answer which could save you a lot of time and money if you bare paying someone to do it.
Accuracy to business is one of the most important things, that’s why spreadsheet has evolved in more ways than one to be more accurate. Once a formula has been complete any changes from there on will be automatically updated, this also saves you time and effort. Sometimes when using a formula if you type something wrong, it may be auto corrected by excel and if you’re not sure how to use formulas, excel has made a bunch of examples on how to use formulas.
Usability to a business is key, being able to share the document your working on with other workers is time saving. Others can access your work by being invited or by being sent a link by email. Once everything is set up, it’s easy to use and understand. With the ribbon at the top of the page with all its features, it should be easy to find and access what you’re looking for.
Unit 9 D1:
The strengths and weaknesses of spreadsheet. Here are a few strengths; auto correct, quick, spell check and software easy to get hold of. Auto correct is a strength because if you’re typing a really long paragraph and miss click a key but continue to type it will auto correct it for you. Quick is one of spreadsheets strengths because with all the features of spreadsheet like auto sum and freeze panes it makes working the spreadsheet a whole lot easier and faster. Spell check is a strength because by clicking one button it checks the spelling of all the words on your document making sure that they are spelled correctly.
Now here are a few weaknesses; human error, complex formulas and delete. Human error is a weakness of spreadsheet because not all errors that humans make on spreadsheet can be correct automatically, like inputing formulas if their new to spreadsheets then they lack of knoledge about excel.
Complex formulas is a weakness of spreadsheet because some formulas can be too complicated for people to understand and therefor not be used right. A weakness of spredsheet is deleteing work or exiting without saving because if you didn’t mean to delete the work but didn’t save it or have a backup then your screwed and have to do the work all over again.


Assessment 2...
P2- Describe the purpose and user requirements for the spreadsheet
In a couple of sentences, state the purpose of the spreadsheet you are going to design.
The purpose of the spreadsheet is to find any profit or loses made by the sales of tickets so the company has an idea of the profit being made, who has bought which seat and in what stand. Another purpose of the spreadsheet is to keep personal details such as contact numbers and addresses. Also a purpose of the spreadsheet is to keep track of any payments made towards a ticket by a person.
In the spaces below list what the user of spreadsheet requires it to do. For example the sporting club might need it to hold details of the customer.
The spreadsheet must include details of the customers such as email addresses, title/first name/surname, address/postcode and phone numbers. This is important so that the club knows all the contact details of who to contact in case of any promotions.
The spreadsheet must contain information to who has bought tickets including a family of 2 adults and 2 kids, OAP’s, under 12’s, the disabled, adult and teens. The ticket should come with a seat number and for which stand there in. There should be a special stand for disabled people with wheelchair access.
The spreadsheet must contain information to how many seats have been sold in a stand therefore they know how many more seats they’re able to sell in that stand.
P3-Produce a design for a spreadsheet, including:
● Worksheet structure diagram
● how output data is to be presented
● A test plan
Add notes below to describe why you have arranged your spreadsheet the way you have.
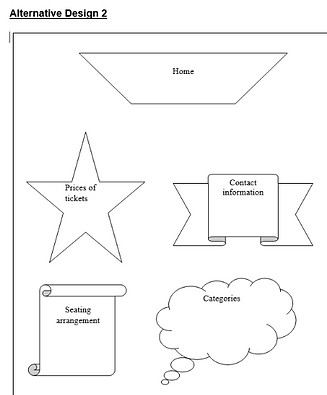
The way I have designed my spreadsheet is to be plain, simple, easy to understand and easy to use. I will use the first sheet as my homepage with links to all other sheets. A logo of the company will be in the right corner. The reason I put the price of tickets first is because I think it’s the most important, my second choice was contact information and details as they need to know who their customers are, seating arrangement was my third choice as you need to know where people are going to be sitting and last I chose categories.
In the spaces below list how your output data is to be presented. Remember that the end user will need useful outputs that are easy to read and understand. Outputs can be numerical or graphical.
< >Pie chart- who has bought the tickets e.g. OAP’s and adults.Line chart- this is to show any profits or loses made by the company.Financial categories report- to show who has made the company the most profit either OAP’s, adults, teens or families. Report of seats sold- to show how many seats have been sold in stands by families, teens, adults and OAP’s.
M1 - Produce detailed designs for a spreadsheet, including:
-
alternative solutions
-
detailed worksheet structure diagram
Using the spaces below describe and illustrate two alternative designs for the workbook. Ensure that you indicate on each design, where the worksheets will be, what content they will have and how user will navigate between sheets. (Switch boards and Macro buttons?)
Alternative Design 1

I have designed my alternative design 1 like I have because the arrangement is in order of the most important first, also the homepage will be the first thing the user sees so it will make the work look easier to use.
Alternative Design 2
Assessmen 3...
Creating the spreadhseet.
I have added a link to my spreadsheet on the right.
Here is a printscreen of my test plan.
